
10 Jan Data That Saves Lives: How Analytics in Medical Registries Reveals the Full Picture
Medical analytics doesn’t start with charts — it starts with trust in the data behind them. When patient information is distributed across multiple systems, the real challenge is not visualization — it is consistency. Even when healthcare organizations rely on powerful platforms such as InterSystems IRIS for Health, inconsistencies can persist: duplicate records, fragmented classifications, and varying data formats.
Without standardization, analytics becomes unreliable. If the foundation is inconsistent, insights will be too. That is why disease registries built on platforms like Kano MDM begin with structured integration, mapping rules, and harmonized data models — long before dashboards are introduced.
From Fragmented Records to Structured Intelligence
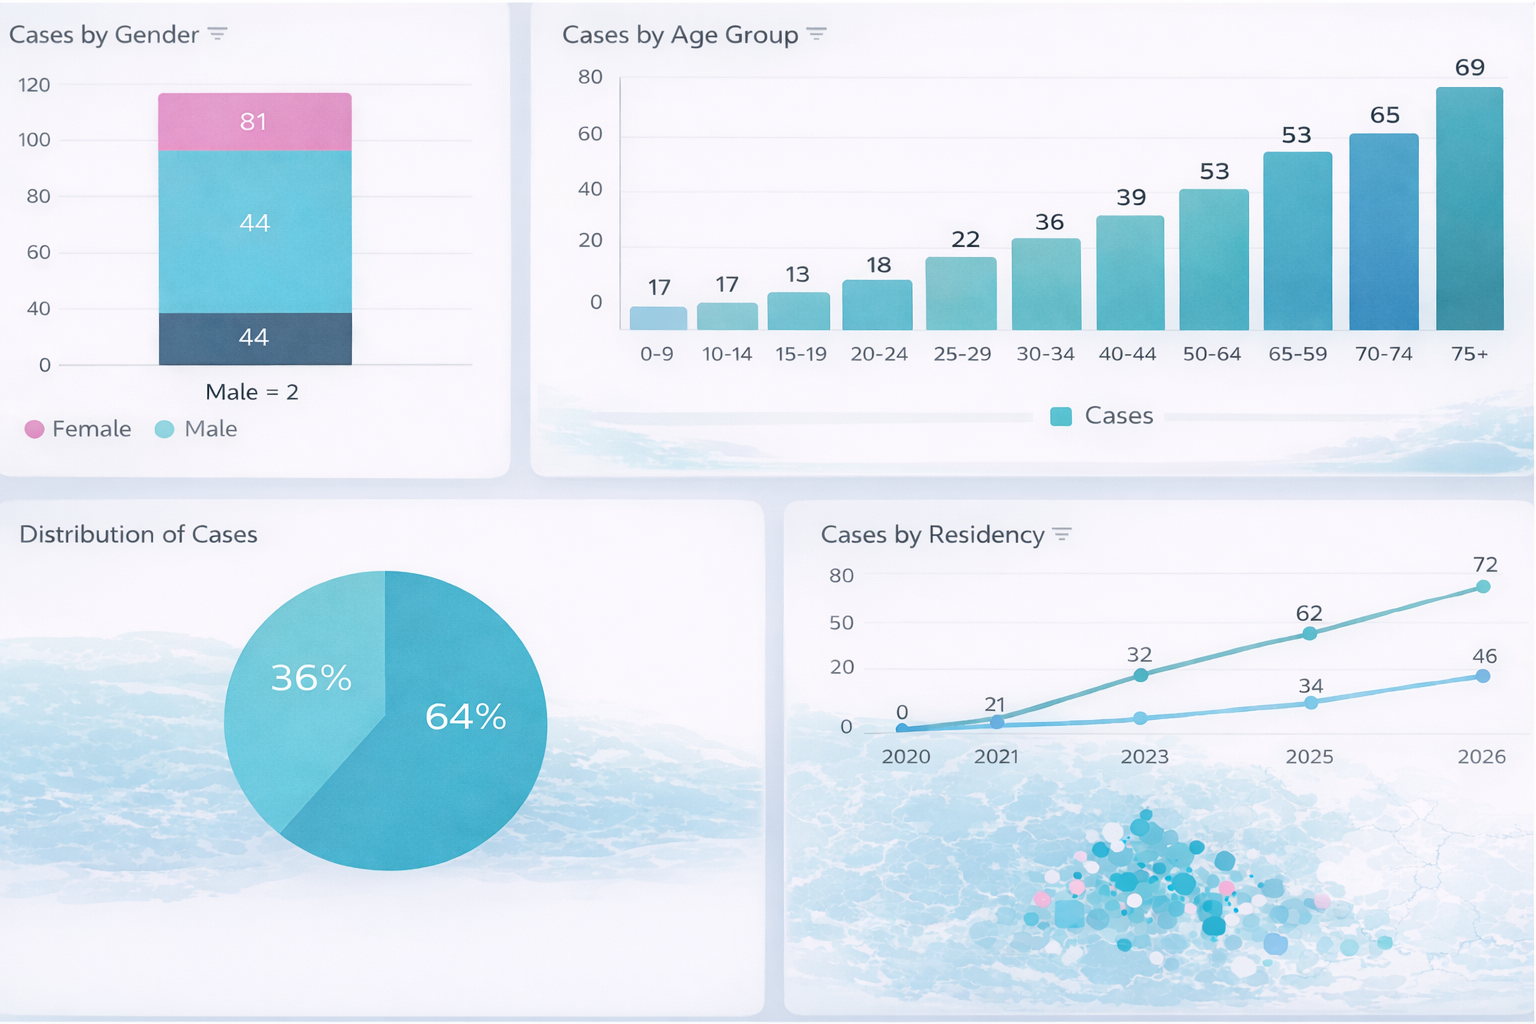
Medical registries consolidate patients, encounters, and diagnoses into a unified analytical framework. Instead of isolated data points, clinicians and analysts see the full patient pathway — from the first diagnosis to inpatient admission, outpatient follow-up, emergency visits, and long-term outcomes. Dashboards go beyond counting patients. They reveal:
- transitions between levels of care,
- readmission patterns,
- sector distribution (public vs. private),
- diagnosis group dynamics over time.
When data is structured correctly, it becomes an ecosystem — not a collection of disconnected records.
Incidence Requires Precision
In healthcare analytics, counting diagnoses is not enough. True incidence requires identifying first-time cases — separating new diagnoses from repeated encounters or follow-ups. Within the registry’s analytical model, each diagnosis is evaluated to determine whether it represents a patient’s first occurrence within the defined classification.
Only those first occurrences are counted as incident cases. This approach prevents overestimation and ensures that reported incidence reflects newly identified patients — not duplicated activity.
It is a methodological detail, but one that directly impacts public health accuracy.
Age Is Context-Dependent
Age is often treated as a static demographic field. In reality, its meaning changes depending on the analytical objective. To ensure accurate interpretation, different scenarios apply different age calculations:
- Incidence analysis — age is calculated at the time of first diagnosis.
- Encounter analysis — age is determined at admission or visit.
- Prevalence analysis — age reflects the current reporting period.
This context-aware approach prevents distortion of age-group patterns and significantly improves the reliability of epidemiological insights.
Adding Geographic and Sector Context
When standardized diagnosis data is combined with administrative regions and facility sector information, analytics gains another dimension. Healthcare organizations can identify:
- geographic areas with increasing disease incidence,
- workload distribution between public and private sectors,
- shifts in disease patterns over time.
Such insights support evidence-based planning, resource allocation, and targeted public health interventions.
Turning Data into Decision Confidence
Healthcare analytics is more than visual reporting. It requires:
- clearly defined inclusion logic,
- accurate first-time case identification,
- scenario-based age grouping,
- and rigorous data standardization.
When these elements work together, medical registries transform complex healthcare data into reliable, actionable intelligence.
Because in healthcare, analytics is not just about numbers — it is about making informed decisions at the right time.